Thursday, 18 February 2016

The Physics of Energy and the Economy


I approach the subject of the physics of energy and the economy with some trepidation. An economy seems to be a dissipative system, but what does this really mean? There are not many people who understand dissipative systems, and very few who understand how an economy operates. The combination leads to an awfully lot of false beliefs about the energy needs of an economy.
The primary issue at hand is that, as a dissipative system, every economy has its own energy needs, just as every forest has its own energy needs (in terms of sunlight) and every plant and animal has its own energy needs, in one form or another. A hurricane is another dissipative system. It needs the energy it gets from warm ocean water. If it moves across land, it will soon weaken and die.
There is a fairly narrow range of acceptable energy levels–an animal without enough food weakens and is more likely to be eaten by a predator or to succumb to a disease. A plant without enough sunlight is likely to weaken and die.
In fact, the effects of not having enough energy flows may spread more widely than the individual plant or animal that weakens and dies. If the reason a plant dies is because the plant is part of a forest that over time has grown so dense that the plants in the under story cannot get enough light, then there may be a bigger problem. The dying plant material may accumulate to the point of encouraging forest fires. Such a forest fire may burn a fairly wide area of the forest. Thus, the indirect result may be to put to an end a portion of the forest ecosystem itself.
How should we expect an economy to behave over time? The pattern of energy dissipated over the life cycle of a dissipative system will vary, depending on the particular system. In the examples I gave, the pattern seems to somewhat follow what Ugo Bardi calls a Seneca Cliff.
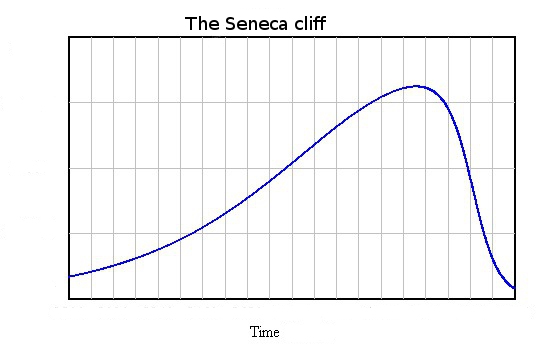
Figure 1. Seneca Cliff by Ugo Bardi
Figure 1. Seneca Cliff by Ugo Bardi
The Seneca Cliff pattern is so-named because long ago, Lucius Seneca wrote:
It would be some consolation for the feebleness of our selves and our works if all things should perish as slowly as they come into being; but as it is, increases are of sluggish growth, but the way to ruin is rapid.

The Standard Wrong Belief about the Physics of Energy and the Economy
There is a standard wrong belief about the physics of energy and the economy; it is the belief we can somehow train the economy to get along without much energy.

In this wrong view, the only physics that is truly relevant is the thermodynamics of oil fields and other types of energy deposits. All of these fields deplete if exploited over time. Furthermore, we know that there are a finite number of these fields. Thus, based on the Second Law of Thermodynamics, the amount of free energy we will have available in the future will tend to be less than today. This tendency will especially be true after the date when “peak oil” production is reached.
According to this wrong view of energy and the economy, all we need to do is design an economy that uses less energy. We can supposedly do this by increasing efficiency, and by changing the nature of the economy to use a greater proportion of services. If we also add renewables (even if they are expensive) the economy should be able to get along fine with very much less energy.
These wrong views are amazingly widespread. They seem to underlie the widespread hope that the world can reduce its fossil fuel use by 80% between now and 2050 without badly disturbing the economy. The book 2052: A Forecast for the Next 40 Years by Jorgen Randers seems to reflect these views. Even the “Stabilized World Model” presented in the 1972 book The Limits to Growth by Meadow et al. seems to be based on naive assumptions about how much reduction in energy consumption is possible without causing the economy to collapse.


About Gail Tverberg


My name is Gail Tverberg. I am an actuary interested in finite world issues - oil depletion, natural gas depletion, water shortages, and climate change. Oil limits look very different from what most expect, with high prices leading to recession, and low prices leading to inadequate supply.


Free Logo From Thefreelogomakers.com


Wednesday, 17 February 2016

Swiss Billionaire Says
​,​
 Massive Bank Crisis
​ 
Hitting 
Singapore

Inline images 1
Billionaire Felix Zulauf:
​ ​
 
​"​
A massive banking crisis is brewing in Singapore:
​"​


( Thanks to Jesse Colombo 
​, Forbes,  ​
for flagging this article
​ and tweet​
)


​Th​e global banking system is in rough shape as the house of cards created by giant credit-driven realty and stock market bubbles  in  China , Asia and elsewhere,  are tumbling down. Remember 2008? The first signs  began with - 
  Societe Generale pulling the plug on  US securitized mortgage debt in early August 2007, that then  triggering trading losses of  4.9 billion pounds  in January 2008.  Then  eight months  later  the crisis heightens and hits  North American  shores  causing a market meltdown, the fall of Lehman Brothers and the greatest banking bailout in US history. Guess what?  This one is much bigger. The consequences are assured to be much uglier .  


Also see
​ more signals​
 - 
​as ​
Singapore, 
​the ​
world’s 2nd largest port, container traffic fell 9% in 2015*, off 12% in January
​, too​
. *1st decline in 6 years:


https://twitter.com/Convertbond/status/698539301240442881


Canadian Banks Sure to Fall  with  Global System
( Thanks to 
​ 
Dan Mathisson
​, International Banking,​
​  
for flagging this article)

Inline images 2

Last time, the Canadian banks were pretty well  immune from the  financial tidal wave that devastated much of the global banking system  in 2008. This time will be a different story. Real estate bubbles in its major cities along with world-leading consumer household debt to disposable income are  thereby placing these national banks on all the international monetary watch lists.   More bubble, bubble troubles...  

Inline images 4
Another case of greedy CEO's levering their institutional balance sheets to create excessive personal bonuses. Grand larceny at its best, when it's done with a pen; not a gun!  So,  it's the same ole game, that begs the question - where are the boards?  More importantly, where are the regulators? Is everyone, since 2008,  "still asleep" at the switch?

They probably don't even know where it is!

Inline images 3


Tuesday, 16 February 2016

Big Declines Bakken Production


Bakken December Data, Big Decline


Image result for the bakken

The Bakken and North Dakota tight oil production data is out.

Bakken production was down 28,604 barrels per day to 1,096,044 bpd. All North Dakota was down 29,506 bpd to 1,152,280 bpd.

This is just the last two years of the chart above. It gives a slightly better look at what is happening.
Bakken BPD per Well
Barrels per day per well fell to 106 in the Bakken and to 90 in all North Dakota.

Producing Wells

November 13,100

December 13,119 (preliminary)(all time high was Oct 2015 13,190)
10,756 wells or 82% are now unconventional Bakken–Three forks wells
2,363 wells or 18% produce from legacy conventional pools.
 –
Permitting

November 125 drilling and 0 seismic
December 95 drilling and 0 seismic
January 78 drilling and 0 seismic (all time high was 370 in 10/2012)
 –
ND Sweet Crude Price

November $32.16/barrel
December $27.57/barrel
January $21.13/barrel
Today’s $16.50/barrel
(lowest since February 2002)(all-time high was $136.29 7/3/2008)
 –
Rig Count

November 64
December 64
January 52
Today’s rig count is 41 (lowest since July 2009 when it was 40)(all-time high was 218 on 5/29/2012)
The statewide rig count is down 81% from the high and in the five most active counties rig count is down as follows:
Divide  -85% (high was 3/2013)
Dunn -76% (high was 6/2012)
McKenzie -75% (high was 1/2014)
Mountrail -88% (high was 6/2011)
Williams -90% (high was 10/2014)


  A Final Note :  

The drilling rig count was steady from November to December, fell sharply from December to January, and again into this month. Operators are now even more committed to running fewer rigs as oil prices remain at very low levels. The number of well completions remained steady from 77(final) in November to 76(preliminary) in December. Oil price weakness is now anticipated to last into at least the third quarter of this year and is the main reason for the continued slow-down. There were no significant precipitation events, 5 days with wind speeds in excess of 35 mph (too high for completion work), and 2 days in Williston with temperatures below -10F.

Over 97% of drilling now targets the Bakken and Three Forks formations.
At the end of December there were an estimated 945 wells waiting on completion services 2, 24 less than at the end of November.
Crude oil take away capacity remains dependent on rail deliveries to coastal refineries to remain adequate.

The drop in oil price associated with anticipation of lifting sanctions on Iran and a weaker economy in China is expected to lead to further cuts in the drilling rig count. Utilization rate for rigs capable of 20,000+ feet is about 30% and for shallow well rigs (7,000 feet or less) about 20%.
Drilling permit activity declined November to December then fell further in January as operators continue to position themselves for low 2016 price scenarios. Operators have a significant permit inventory should a return to the drilling price point occur in the next 12 months.


Free Logo From Thefreelogomakers.com


Monday, 15 February 2016

EIA's Predictions Questionable - OPEC Call is the Fudge Number!


Just How Accurate Are The EIA’s Predictions?


The EIA recently published the February edition of their Short-Term Energy Outlook. If you follow this month to month, and we do, you will notice their prognostications change a little every month. And over several months those small changes can add up to some rather dramatic changes. Nevertheless, below are several charts with their current oil production projections.
The EIA STEO only gives monthly data for total liquids. All C+C data is quarterly and annually. The monthly projected data begins in February 2016. Projections for quarterly and annual data begins January 2016.
ST Non-OPEC Liquids
The EIA says Non-OPEC total liquids dropped .5 million barrels per day in December and another .36 mbd in January. But then, other than another short drop in the first quarter of 2017, they see things leveling out for the next two years.
ST World Liquids
For the total world, the EIA expects far better production numbers than just for Non-OPEC. They expect new highs to be reached in 2016 and again in 2017.
ST US Liquids
They see US total liquids dropping in 2016 then they begin a slow rise through 2017, but not overtaking the peak in 2015.
ST Russia Liquids
Image result for putin badass
Apparently the EIA thinks Russia has had it. They see a drop in December 2016 then a huge drop in January  2017. We have no idea why. However the scale here makes the decline seem greater than it really is. From January 2015 to December 2017 the decline is only 400,000 barrels per day.
ST Eurasia Liquids

Adding the other FSU nations to the mix, mostly Azerbaijan and Kazakhstan, only exacerbates the decline, making it half a million bpd between January 2015 and December 2017.
ST Non-OPEC C+C A

Looking at just Crude + Condensate you get a better picture of what the EIA really expects in the next two years.  They expect Non-OPEC C+C to drop 580,000 bpd in 2016 and another 170,000 bpd in 2017 for a total of 750,000 bpd over the two years.
ST OPEC Total Liquids A
They are expecting far better things out of OPEC's gang.  They have the OPEC gangs total liquids up 1,010,000 barrels per day in 2016 and another 870,000 bpd in 2017. They do not project OPEC C+C.
But taking a closer look at their US Projections:
ST US C+C A
The EIA expects US C+C to drop 740,000 barrels per day in 2016 and another 230,000 bpd in 2017 for a total decline over two years of 970,000 barrels per day. 
ST US Liquids A  
However they have US total liquids faring much better then just C+C. They have total liquids declining by only 490,000 barrels per day in 2016 and increasing by 100,000 bpd in 2017.
ST US Other Liquids A
What this means is that US “Other Liquids”, that is NGLs, biofuels and refinery process gain must show a very impressive gains while everything else is going to pot. They show other liquids increasing by 250,000 bpd in 2016 and another 330,000 bpd in 2017. 
Most of this increase has to come from NGLs as biofuels are only a minor input and refinery process gain pretty much follows C+C consumption. But…
ST US Other Liquids % Increase 
Using their projections for Dry Gas production we find that gas production increased more than other liquids increased in 2015. However they say gas production will increase by only .4 percent in 2016 while other liquids increase by 4.6 percent, and a similar story in 2017 though not quite as dramatic.
Bottom line: We find the EIA’s past production data very accurate. However their projections appear to be pretty lame. This observation is proven out by the fact that those projections are constantly changing. Also, those “Other Liquids” projections seem to make no sense whatsoever. It appears to be mostly a fudge.  
Image result for yogi bear
But the very biggest problem with the EIA’s projections are with OPEC. That is because it is not a projection at all but an estimate of what will be needed to meet world demand. That is they estimate Non-OPEC production, then they estimate world demand, and the difference between the two will be the “Call on OPEC”. That is, they will simply expect OPEC to make up the difference, whatever that difference may be.
Lately, however, OPEC seems to be producing a lot more than their call asked them to. That is, they appear to be ignoring their call. And they will likely do likewise when they are expected to produce more to meet demand. They are all currently producing flat out and if there is a call on them to produce more, it will very likely go unanswered. 
WE thus  expect the “Call on OPEC” is a running joke between OPEC nations.

Image result for wile e coyote
______________________________________________________

Zurich Partners and PRIVATE Community

Zurich Partners and PRIVATE Community
The Edge For Leading International, Regional and Local Insights

Blog Archive